🔥 Check out v2 here! Newer data, newer models! 🔥
Cross-Media Learning for Image Sentiment Analysis in the Wild
Lucia Vadicamo,
Fabio Carrara,
Andrea Cimino,
Stefano Cresci,
Felice Dell'Orletta,
Fabrizio Falchi,
Maurizio Tesconi
Abstract
Much progress has been made in the field of sentiment analysis in the past years. Researchers relied on textual data for this task, while only recently they have started investigating approaches to predict sentiments from multimedia content. With the increasing amount of data shared on social media, there is also a rapidly growing interest in approaches that work ``in the wild'', i.e. that are able to deal with uncontrolled conditions. In this work, we faced the challenge of training a visual sentiment classifier starting from a large set of user-generated and unlabeled contents. In particular, we collected more than 3 million tweets containing both text and images, and we leveraged on the sentiment polarity of the textual contents to train a visual sentiment classifier. To the best of our knowledge, this is the first time that a cross-media learning approach is proposed and tested in this context. We assessed the validity of our model by conducting comparative studies and evaluations on a benchmark for visual sentiment analysis. Our empirical study shows that although the text associated to each image is often noisy and weakly correlated with the image content, it can be profitably exploited to train a deep Convolutional Neural Network that effectively predicts the sentiment polarity of previously unseen images. The dataset used in our experiments, named T4SA (Twitter for Sentiment Analysis), is available on this page.
Paper (PDF, BibTex)
The paper will be presented at the 5th Workshop on Web-scale Vision and Social Media (VSM, 23rd October 2017), ICCV 2017
Poster
Dataset
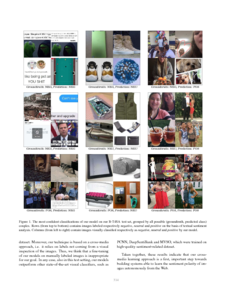
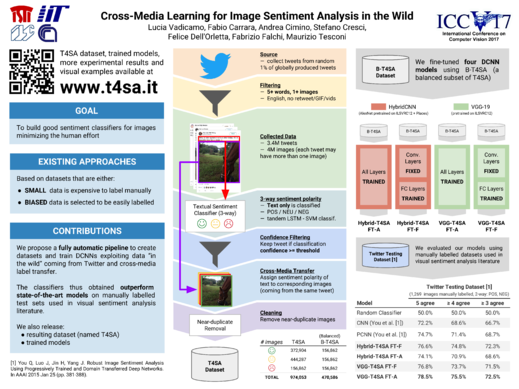
The data collection process took place from July to December 2016, lasting around 6 months in total. During this time span, we exploited Twitter's Sample API to access a random 1% sample of the stream of all globally produced tweets, discarding:
- tweets not containing any static image or containing other media (i.e., we also discarded tweets containing only videos and/or animated GIFs)
- tweets not written in the English language
- tweets whose text was less than 5 words long
- retweets
At the end of the data collection process, the total number of tweets in our dataset is ~3.4M, corresponding to ~4M images.
Each tweet (text and associated images) has been labeled according to the sentiment polarity of the text (negative = 0, neutral = 1, positive = 2) predicted by our tandem LSTM-SVM architecture, obtaining a labeled set of tweets and images divided in 3 categories. We selected the tweets having the most confident textual sentiment predictions to build our Twitter for Sentiment Analysis (T4SA) dataset. We removed corrupted and near-duplicate images, and we selected a balanced subset of images, named B-T4SA, that we used to train our visual classifiers.
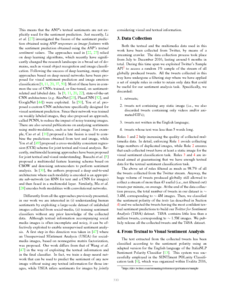
The details of the dataset are reported in the following table.
| Sentiment |
T4SA (tweets) |
T4SA (images) |
T4SA (w/o near dups) (images) |
B-T4SA (images) |
|---|---|---|---|---|
| Positive | 371,341 | 501,037 | 372,904 | 156,862 |
| Neutral | 629,566 | 757,895 | 444,287 | 156,862 |
| Negative | 179,050 | 214,462 | 156,862 | 156,862 |
| Sum | 1,179,957 | 1,473,394 | 974,053 | 470,586 |
Once you have requested and received your credentials, you can download different packages of the dataset using the following links:
- b-t4sa_imgs.tar (63GB): contains only the 470,586 images of the B-T4SA dataset and train/val/test splits used in our experiments.
- t4sa_all_imgs.tar (177GB): contains all the 1,473,394 images corresponding to the 1,179,957 tweets of the T4SA dataset (a tweet may have multiple images). It also contains list files to select images packed in t4sa_imgs_nodups.tar and b-t4sa_imgs.tar.
- t4sa_imgs_nodups.tar (133GB): contains the 974,053 images obtained from t4sa_all_imgs.tar removing corrupted and near-duplicates images. It also contains list files to select the images packed in b-t4sa_imgs.tar.
- t4sa_text_sentiment.tsv (74MB): contains the textual sentiment classification of the 1,179,957 selected tweets of the T4SA dataset.
- raw_tweets_text.csv (414MB): contains id and text of all the collected ~3.4 M tweets.
Trained Models
Here you can download the trained models used in our experiments. Models have been trained with BVLC Caffe and DIGITS. The following archives can be directly imported into DIGITS. Check out also the PyTorch code with converted models: https://github.com/fabiocarrara/visual-sentiment-analysis
- VGG-T4SA FT-A
- vgg19_finetuned_all.tar.gz (518.2 MB)
- VGG-T4SA FT-F
- vgg19_finetuned_fc6+.tar.gz (518.2 MB)
- Hybrid-T4SA FT-A
- hybrid_finetuned_all.tar.gz (210.9 MB)
- Hybrid-T4SA FT-F
- hybrid_finetuned_fc6+.tar.gz (210.9 MB)
Hybrid-T4SA models are Hybrid-CNNs (AlexNet trained on ILSVRC12 + Places205) finetuned on our T4SA dataset, while VGG-T4SA models are VGG-19 nets trained on ILSVRC12 and then finetuned on T4SA. In FT-A models, all layers have been finetuned, while in FT-F model convolutional layers are fixed and only fully-connected layers are finetuned.
You can check the performance of the available models in the Experimental Results section.
If you have used our data or trained models in a scientific publication, we would appreciate citations to the following paper:
@InProceedings{Vadicamo_2017_ICCVW,
    author = {Vadicamo, Lucia and Carrara, Fabio and Cimino, Andrea and Cresci, Stefano and Dell'Orletta, Felice and Falchi, Fabrizio and Tesconi, Maurizio},
    title = {Cross-Media Learning for Image Sentiment Analysis in the Wild},
    booktitle = {2017 IEEE International Conference on Computer Vision Workshops (ICCVW)},
    pages={308-317},
    doi={10.1109/ICCVW.2017.45},
    month = {Oct},
    year = {2017}
}
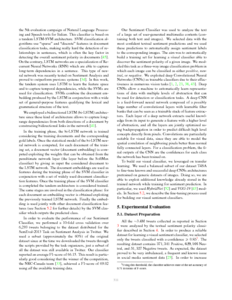
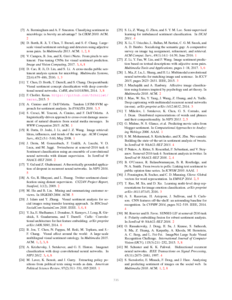
Experimental Results
In the first table, we report the performance of the models we trained, together with other previously published methods, on two testing datasets: Twitter Testing Dataset and B-T4SA test split.
In the second table, we report the accuracy of different models when performing cross-validation on the Twitter Testing Datatset.
| Model | Twitter Testing Dataset (2-way: pos, neg) |
B-T4SA test set (3-way: pos, neu, neg) |
||
|---|---|---|---|---|
| 5 agree | ≥ 4 agree | ≥ 3 agree | ||
| Random Classifier | 50.0% | 50.0% | 50.0% | 33.3% |
| CNN (You et al.) | 72.2% | 68.6% | 66.7% | - |
| PCNN (You et al.) | 74.7% | 71.4% | 68.7% | - |
| Hybrid-T4SA FT-F | 76.6% | 74.8% | 72.3% | 49.9% |
| Hybrid-T4SA FT-A | 74.1% | 70.9% | 68.6% | 49.1% |
| VGG-T4SA FT-F | 76.8% | 73.7% | 71.5% | 50.6% |
| VGG-T4SA FT-A | 78.5% | 75.5% | 72.5% | 51.3% |
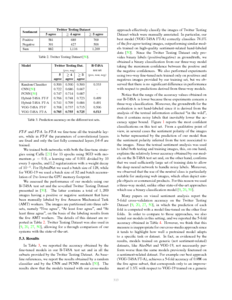
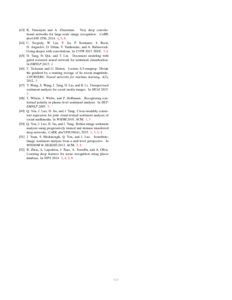
| Twitter Testing Dataset | ||||
|---|---|---|---|---|
| Method | Training derails | 5 agrees | ≥ 4 agrees | ≥ 3 agrees |
| Approaches without intermediate fine-tuning | ||||
| GCH * | - | 68.4% | 66.5% | 66.0% |
| SentiBank ○ | - | 70.9% | 67.5% | 66.2% |
| LCH * | - | 71.0% | 67.1% | 66.4% |
| GCH + BoW * | - | 71.0% | 68.5% | 66.5% |
| LCH + BoW * | - | 71.7% | 69.7% | 66.4% |
| Sentribute ○ | - | 73.8% | 70.9% | 69.6% |
| CNN ● | Custom architecture tr. on Flickr (VSO) | 78.3% | 75.5% | 71.5% |
| AlexNet ● | AlexNet tr. on ILSVRC2012 | 81.7% | 78.2% | 73.9% |
| PlaceCNN ● | AlexNet tr. on Places205 | 83.0% | - | - |
| GoogleNet ● | GoogleNet tr. on ILSVRC2012 | 86.1% | 80.7% | 78.7% |
| HybridNet ● | AlexNet tr. on (ILSVRC2012 + Places205) | 86.7% | 81.4% | 78.1% |
| VGG-19 ● | VGG-19 tr. on ILSVRC2012 | 88.1% | 83.5% | 80.0% |
| Approaches using an intermediate fine-tuning | ||||
| PCNN ● | Custom architecture tr. on Flickr (VSO) + ft. on Flickr (VSO) | 77.3% | 75.9% | 72.3% |
| DeepSentiBank ○● | AlexNet tr. on ILSVRC2012 + ft. on Flickr (VSO) | 80.4% | - | - |
| MVSO [EN] ○● | DeepSentiBank ft. on MVSO-EN | 83.9% | - | - |
| Hybrid-T4SA FT-A (Ours) ● | AlexNet tr. on (ILSVRC2012 + Places205) + ft. on B-T4SA | 86.4% | 83.0% | 80.0% |
| Hybrid-T4SA FT-F (Ours) ● | AlexNet tr. on (ILSVRC2012 + Places205) + ft. on B-T4SA | 87.3% | 83.2% | 81.0% |
| VGG-T4SA FT-F (Ours) ● | VGG-19 tr. on ILSVRC2012 + ft. on B-T4SA | 88.9% | 85.7% | 81.5% |
| VGG-T4SA FT-A (Ours) ● | VGG-19 tr. on ILSVRC2012 + ft. on B-T4SA | 89.6% | 86.6% | 82.0% |
|
* Approch based on low-level features ○ Approch based on mid-level features ● Approch based on deep learning |
||||